Follow the below steps to perform the t-test with our one/two sample t test calculator:
Give Feedback What do you think of t test calculator?
 Worst
Worst
 Poor
Poor
 Average
 Good
Good
 Excellent
T-test calculator is an online statistical tool that performs t-tests for one and two-sample data. Our student t test calculator calculates critical values for selections of data: “Group data”, “Mean, SEM, & N”, and “Mean, SD, & N”.
This t statistic calculator finds the t-statistics value and compares with the t-critical value to show whether the data is significant or not for experiment. Our paired t-test calculator performs tests with detailed steps by using unpaired test statistics formula (for equal variances) and Welch’s formula (for unequal variances).
T test is a statistical technique that is used to measure the difference between the mean values of one and two sample datasets by using hypothesis testing. It is also known as the student’s t-test and is used when data has a normal distribution & unknown variances.
T-test is performed based on the group data values for one-group and two-group data. The t-test uses t-statistic, t-distribution values, and degrees of freedom to find critical values of data.
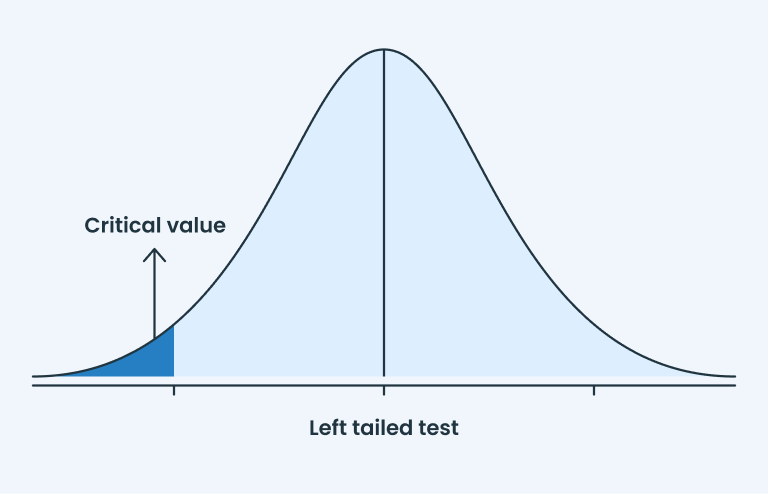
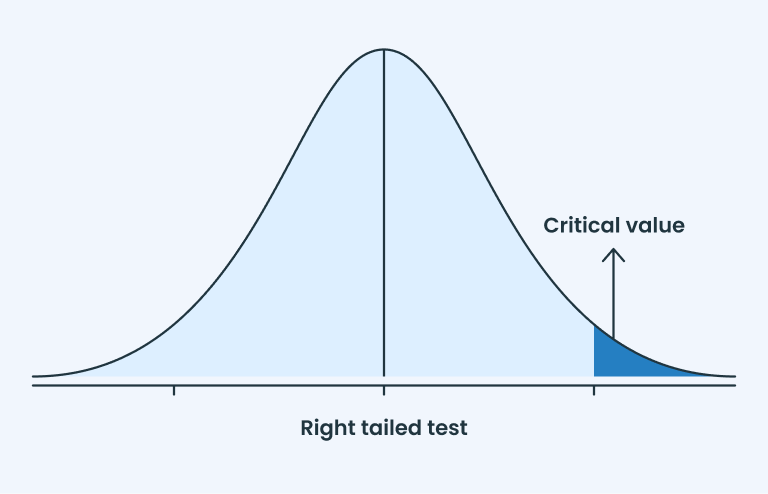
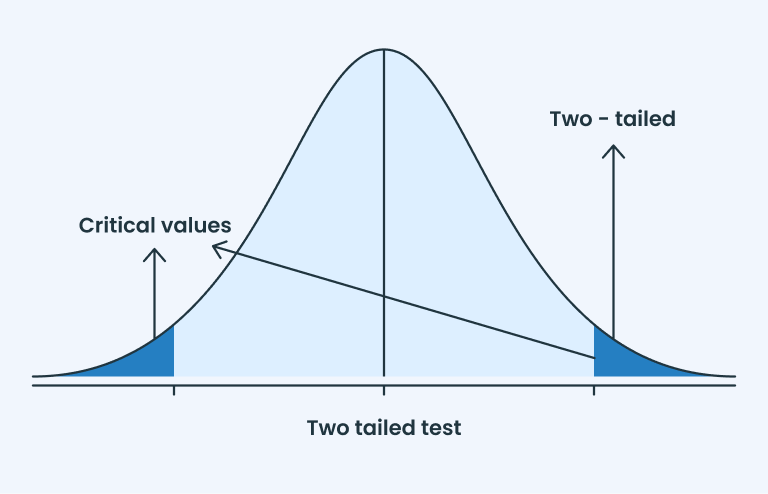
T-value is represented on the normal distribution curve, which is further categorized in other types such as one-tailed (right tail & left tail) and two-tailed. For clarification see the below representation:


There are three types of t-tests to compare the means of data groups and each test is performed on the base of the group data values.
One-sample t test is a statistical hypothesis test that is used to compare the data values of one sample and conclude to reject or select a null hypothesis. It determines a significant relation between the data & hypothesis by comparing T-formula value (Tcalculated) with t-critical value (Tcritical).
Two-sample t test is used to compare values of two independent groups and conclude the result to select or reject the null hypothesis by critical values. It determines significant differences between the average values of two groups based on sample/population data.
Paired t-test is used to compare the means of two related groups and determine significant differences between them. This test is applied if the samples are independent but there are some matches or relations between data (i.e., data of same object before and after changing). Due to this, it is also known as a dependent or correlated t-test.
The t-test formula is used to find the t-statistic value that compares with the t-critical values to find significant relation between the group’s data. Formula selection depends on the type of t-test (one sample, two samples, or paired tests) that is used for hypothesis testing. Formulas are given below according to the types:
This formula is used in a one-sample t-test to find the t-statistic value.
T = (x̄ − μ)/(σ/√n)
For t-critical use the degree of freedom & significance level in the t-distribution table. The degree of freedom is found by “df = n-1”.
Where:
Two sample formulas are used in the independent t-test to find the student t-value of two unpaired groups. This formula is further categorized into two types due to the variances of data: the test statistics formula and Welch’s formula for equal and unequal variances, respectively.
This unpaired statistics formula is used when the variances are equal and data groups are unpaired. In this degrees of freedom are determined by “df = n1 + n2 -2” and its statistics formula is:
T = (x̄1 − x̄2)/√(Sp2.(1/n1+ 1/n2))
Sp2 = (n1-1)S12 + (n2-1)S22/( n1+ n2-2)
This formula is used when the variances are unequal and data groups are unpaired.
T = (x̄1 − x̄2)/√( S12 /n1+ S22 /n2)
For t-critical value use the degree of freedom & significance level. The degree of freedom is found by the below formula:
Df = (S12/n1)2 + (S22/n2)2/{[(S12/n1)2/(n1−1)] + [(S22/n2)2/(n2−1)]}
Where:
Paired sample formula is used when performing dependent t test (paired t-test) to calculate the t-statistic based on the differences between paired observations.
T = (Σ(x1−x2)/n)/(Sd/√n)
Simply written as:
T = d̄/(Sd/√n)
where
To perform a t-test manually follow the below realistic step and find the t-statistic & critical value. But for a quick solution use our T-test calculator which provides an accurate answer with detailed steps.
What is a paired t test?
Paired t-test also known a dependent t test that is used to find significant differences between the means of two related groups. It applies when both data groups are dependent.
How to interpret t-test results?
To interpret the t-test results find the test statistics value with its formula and compare with the critical value. Then interpret the results to reject or fail to reject the null hypothesis (H0) according to the conditions. For instant results use our t test calculator.
When to use t test?
T-test is used when data has a normal distribution and variances are unknown. It is used to measure significant differences between the means of one or two groups with a specific value.
When to reject null hypothesis t test?
In the t-testing compare the absolute value of the t-statistic “∣t∣” with the critical t-value that is found from the t-distribution table by using degrees of freedom and significance level. The condition to reject the null hypothesis, if ∣t∣ >tcritical.
