T-table (t distribution table), is a statistical reference table that is used to find the t critical values. It is determined by the intersection of rows and columns of the t-distribution table by using degrees of freedom and significance level (typically alpha=0.05) of the given data.
This t-critical (student t-value) is used in hypothesis testing & confidence intervals to compare with the t statistics (t calculated) value and determine whether the given data is statistically significant or not and select or reject the null hypothesis.
T table is also known as the student’s t table, t-score table, t-value table, t statistic table, or t-test table. Student’s t table is useful when sample sizes are small and the population standard deviation is unknown.
T-score table is categorized into two types based on the direction of the critical value (one tail or two tails). The names of its types are given below:
The one-tailed t-distribution and two-tailed t-distribution tables have degrees of freedom up to “1000”, a significance level between “0 to 1”, and a confidence level up to 99.9%.
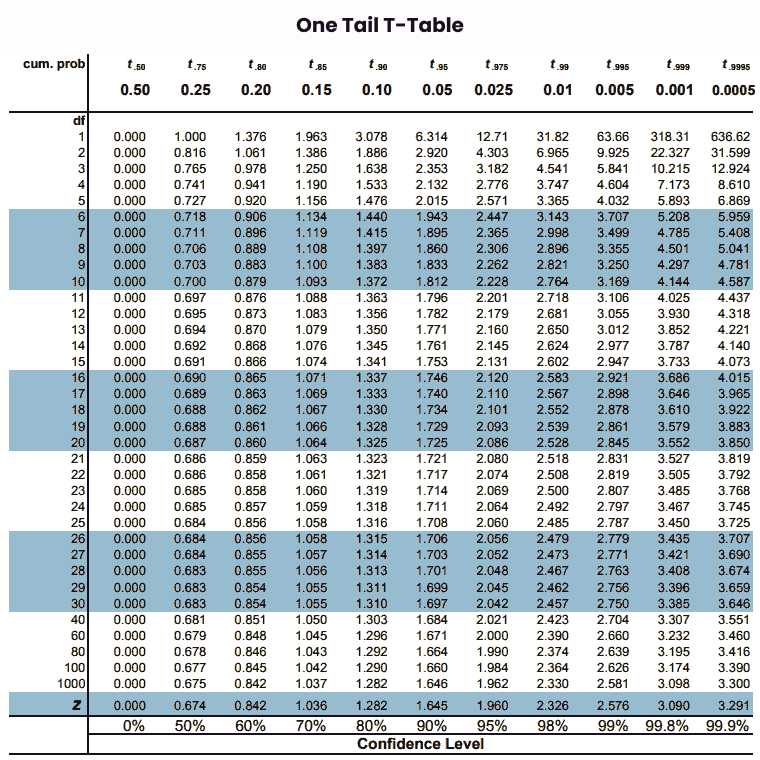
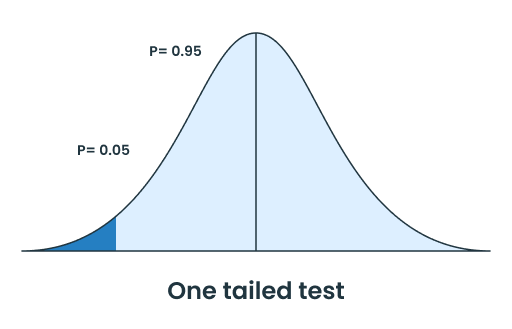
One Tail t table is used to find critical values in one direction (left or right tail) to perform a one-tail t-test or hypothesis test. It provides the probability values of a t-statistic that falls within a specific one-sided area of the t-distribution, based on the given degrees of freedom and significance level (alpha).
The detailed one-tail t table is given in the below picture with the proper representation of degrees of freedom, confidence level, and alpha values.

Free Usage Disclaimer: Feel free to use and share the above images of T-Table as long as you provide attribution to our site by crediting a link to https://www.criticalvaluecalculator.com/ |
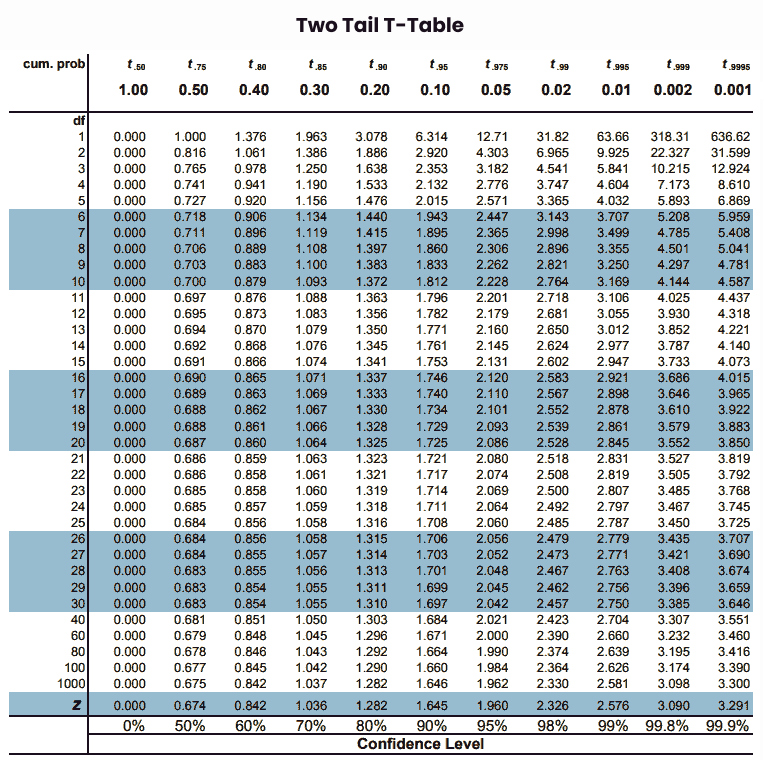
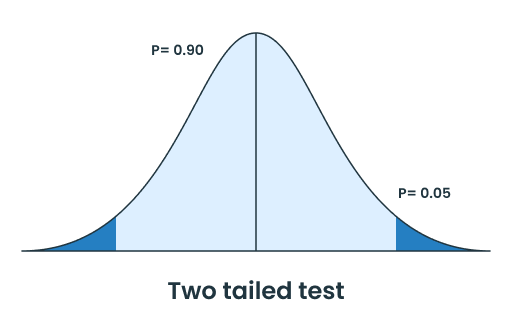
Two Tail T Table is also used to determine critical values for a t-distribution to performing hypothesis testing or t-tests, but it is used for the two tail tests. It gives the rejection region to select or reject the null hypothesis for a test, by comparing test statistic values in positive and negative directions for the given deviation values.
This table listed t-values for various significance levels (alpha), degrees of freedom, and confidence levels. For a detailed overview of two tail tables see the below picture.

To read the t-score table and find the critical t-value. First, you need to know about the components of the t-distribution table and one-tailed & two-tailed tests.
| One Tailed Test | Two Tailed Test |
|---|---|
 |
 |
See the below examples to calculate the t value for one tail & two tails by using the respective t statistics table. These examples are solved with detailed steps that help to understand how to use the t table & find the t-critical value.
Example 1: Find the t value for an alpha level of 0.01 and a sample size is 25 to perform a one-tailed t-test.
Solution:
Step 1: First, we select the table according to the test.
Here, data is given for one-tailed t test then we selected the one tail t distribution table.

Step 2: Calculate the degrees of freedom of given data.
The degrees of freedom can be found by “n-1” where “n” is the sample size. For instant results use our degrees of freedom calculator.
Df = n – 1 = 25 – 1 = 24
Step 3: Note the value of α-level from the given data.
α = Significance level = 0.01
Step 4: Now, highlight the alpha value at the top of the selected t-score table.
Our alpha level is “0.01” then we map on one tail t table.
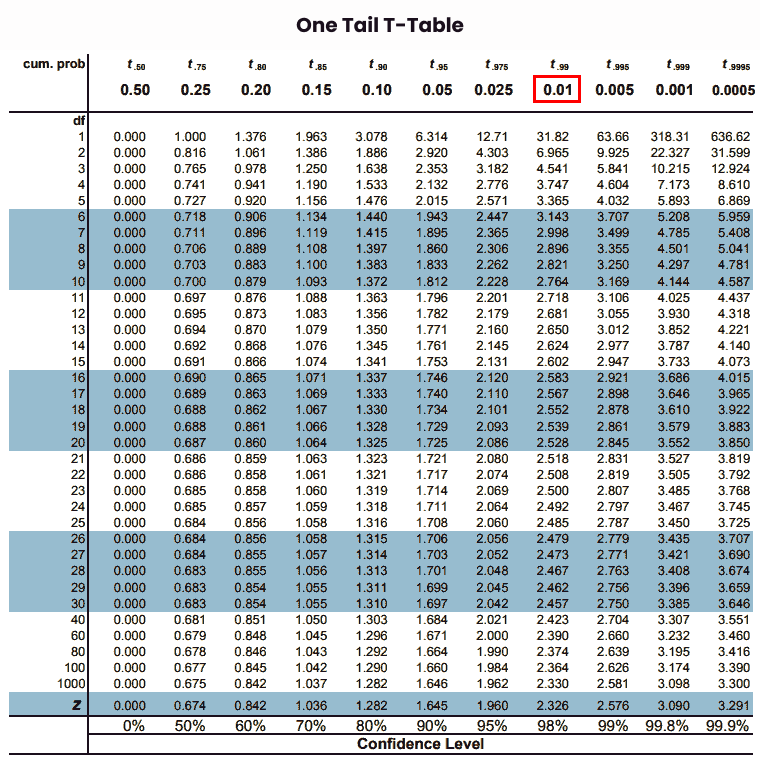
Step 5: Now, map the degrees of freedom of given data on the leftmost column of the critical value table.
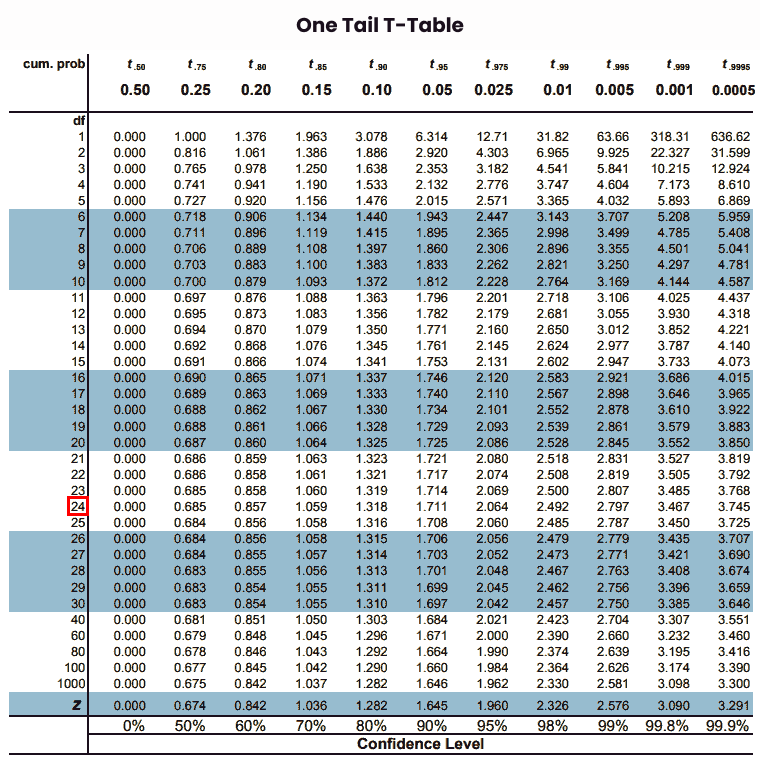
Step 6: Finally, note the intersection of “df” and alpha values from rows & columns of the t table chart.
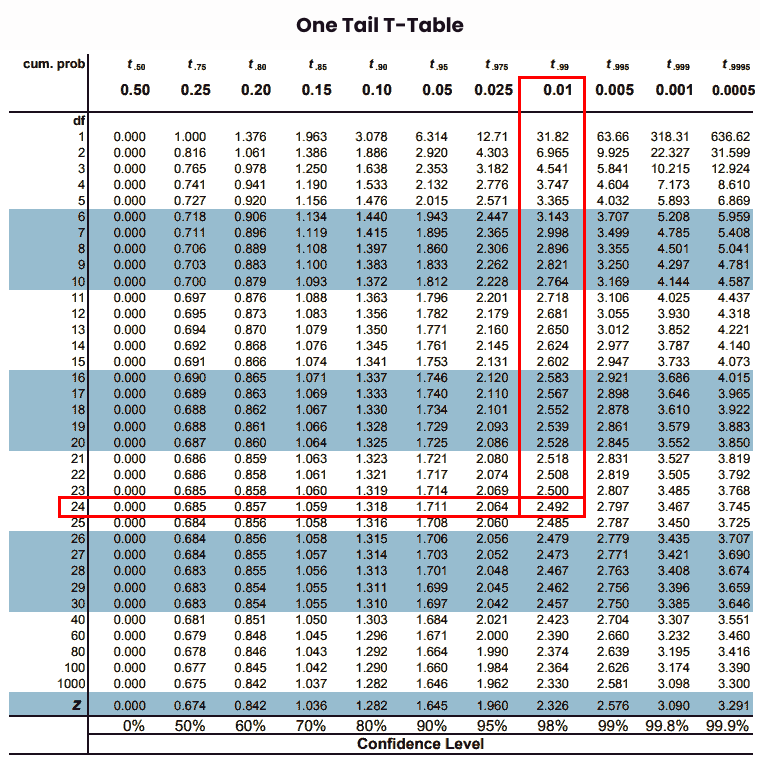
Thus, the required t-critical value is “2.492” by using one tail t-value table.
Example 2: Calculate the t value when performing the two-tailed t-test, if the alpha level is 0.05 and the sample size is 30.
Solution:
Step 1: First, we select the table according to the test.
Here, given data for a two-tailed t test then we selected the two tail t distribution table.

Step 2: Find the degrees of freedom of given data.
The degrees of freedom can be found by “n-1”.
Df = n – 1 = 30 – 1 = 29
Step 3: Note the value of α-level from the given data.
α = Significance level = 0.05
Step 4: Now, highlight the alpha value at the top of the selected t-score table.
Our alpha level is “0.05” then we map on one tail t table.
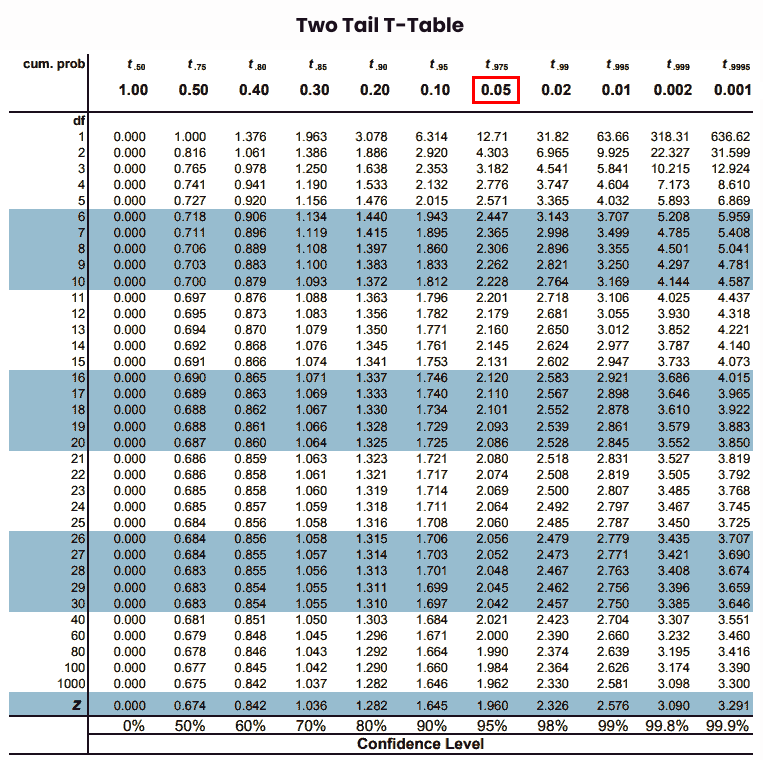
Step 5: Now, map the degrees of freedom of given data on the leftmost column of the critical-value table.
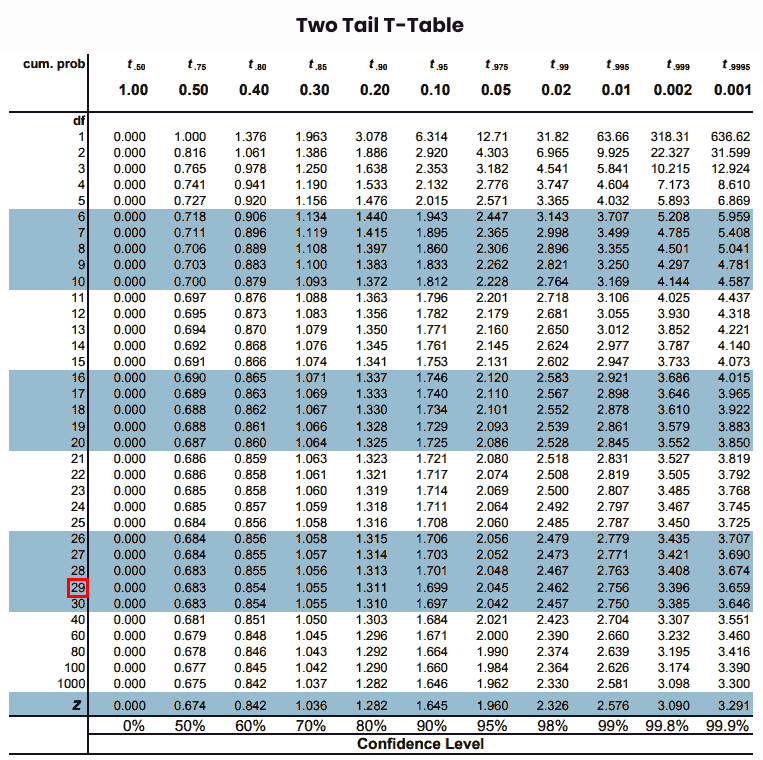
Step 6: Finally, note the intersection of “df” and alpha values from rows & columns of the t table chart.
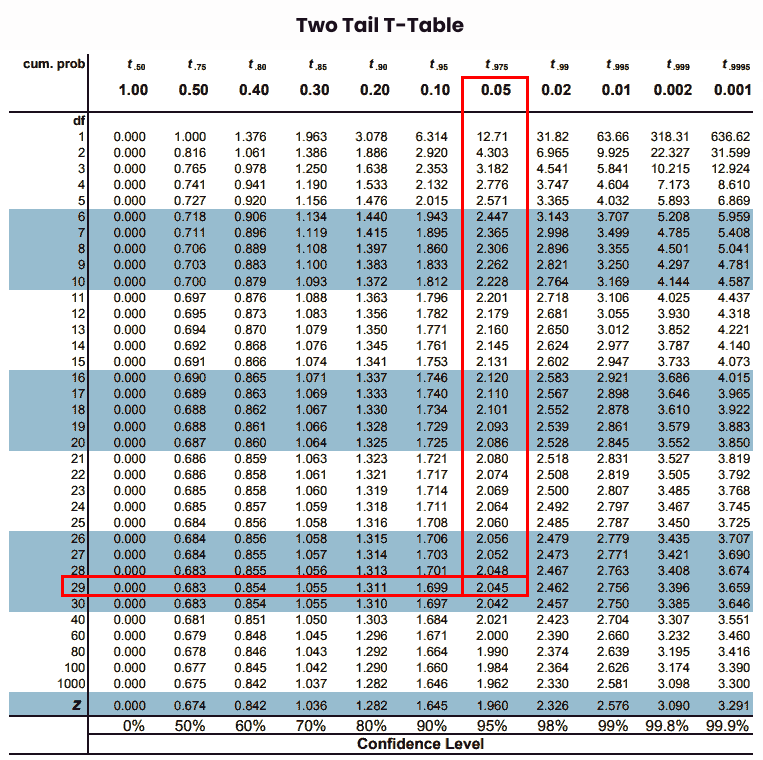
Thus, the required t-critical value is “2.045” by using a two tail t-value table.
What is a t-score?
A t-score is a statistical measure that shows how much the standard deviation value is away from the mean. It is calculated by using sample mean, sample standard deviation, and sample size.
What is a critical value in a T table?
A critical value is the threshold value calculated using the t value table. It is used to reject or fail to reject a null hypothesis by comparing it with the significance level or T statistic value.
What are degrees of freedom (df) in a T table?
Degrees of freedom is the amount that is used to estimate t table value from the t score table. It is calculated from the sample size by a formula “n-1” and represented along the left column of the t table.
How to Find the T Statistics Value?
T chart stats can be found by using the t value formula in which uses the sample mean, population mean, and standard deviation values. Its formula is: T = (x̄ - μ)/(S/√n).
What are the other names of T table?
T table has many other names due to its representation and finding value. T table is named as t distribution table, student’s t table, t-score table, t-value table, t statistic table, t chart table, t critical value table, or t-test table.