Give Feedback What do you think of correlation coefficient calculator?
 Worst
Worst
 Poor
Poor
 Average
 Good
Good
 Excellent
The Correlation Coefficient calculator solves the Correlation Coefficient (R), Mean of x, Mean of y, Difference of Data set x and x mean (x- x̄), and Difference of Data set y and y mean (y- ȳ).
It also calculates the Square of the differences i.e. (x- x̄)2 and (y- ȳ)2 respectively using two different data sets X and Y.
Both data sets must have an equal number of terms.
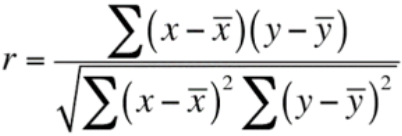
The correlation coefficient is the specific measure that quantifies the strength of the linear relationship between two variables in a correlation analysis. It is denoted by r.
The correlation coefficient formula is given below:

Where
There are two different types of Correlation coefficients:
Generally, Pearson’s correlation coefficient is known as Pearson’s r or simply the correlation coefficient. Its range is -1 to 1.
Spearman's rank correlation coefficient or Spearman's ρ, named after Charles Spearman. It describes the relation between two monotonic variables.
The correlation coefficient is the ratio between the covariance of any two variables, say, X & Y to the product of their standard deviation.
With the help of the following example, you will be able to find the correlation coefficient.
Example:
Let x be any data set having values 2, 7.5, 3, 34.2, 26, and y data set 21, 12.5, 3, 11, 17. Find the Correlation coefficient r.
Solution:
x = 2, 7.5, 3, 34.2, 26
y = 21, 12.5, 3, 11, 17
Step 1: Calculate the mean of the data sets
x̄ = (2 + 7.5 + 33 + 34.2 + 26)/5 = 14.540
ȳ = (21 + 12.5 + 3 + 11 + 17)/5 = 12.900
| x | y | x-x̄ | y-ȳ | (x- x̄)2 | (y-ȳ)2 | (x- x̄)(y-ȳ) |
| 2 | 21 | -12.540 | 8.100 | 157.252 | 65.610 | -101.574 |
| 7.5 | 12.5 | -7.040 | -0.400 | 49.562 | 0.160 | 2.816 |
| 33 | 3 | -11.540 | -9.900 | 133.172 | 98.010 | 114.246 |
| 34.2 | 11 | 19.660 | -1.900 | 386.516 | 3.610 | -37.354 |
| 26 | 17 | 11.460 | 4.100 | 131.332 | 16.810 | 46.986 |
| 857.832 | 184.200 | 25.120 |
Step2: Calculation of r
Correlation coefficient Formula = r = ∑ ((x - x̄) (y-ȳ)) / √(∑ (x-x̄)2 ∑ (y-ȳ)2)
Putting the values in the above formula.
r = 25.12 / √ ((857.832) (184.2))
r = 0.0632
How to verify whether the answer is correct or not.
As r = 0.0632, the answer is between -1 and 1, so the answer is correct because the range of the correlation coefficient is -1 to 1.
